Debugging PHP with Xdebug, PHP Storm and AWS Elastic Beanstalk
Getting Xdebug running is usually a pain on a normal PHP server, Elastic Beanstalk (EB) makes this even more difficult as AWS has done some interesting things to the server. The high level steps are as follow:
- Create SSH key and Security group
- Create new EB Application, then PHP web server environment, using the sample project
- Download code, add .extension files to install and config Xdebug then deploy new version
- Create SSH tunnel using PuTTY
- Config PHP Storm to use the debugger and test.
Prerequisites:
- Basic knowledge about AWS, EB, SecurityGroups and keys
- SSH knowledge
- Basics of how Xdebug works
- Patience
#Get the EB Environment ready
Let’s create an Environment, nothing special here, we just need to make sure that we create a SSH Key pair and have the correct security group.
To create a security group, go to EC2 -> Security Groups, then create a new one if you do not already have one that has the basics and then port 9000 open. This port is used by Xdebug communication. Below is a screenshot of the security group inbound rules, note that all traffic is allowed on the outbound rules. (Actually I do not think we need to have this port open, since we are using the SSH Tunnel that goes through port 22)

Then we need to create a Key pair so that we can SSH to the instance. We don’t need to SSH and do any commands on the instance, the .ebextension files within the application code handles all of the server config. We just need to create an SSH tunnel using putty so that the server can communicate with our IDE that uses Xdebug. The advantage of the SSH tunnel is that it circumvents any potential firewall problems that we might have. As both the server and IDE needs port 9000 open, this is not always possible and easy in a corporate environment either.
The second reason for the SSH tunnel is for security purposes. We don’t want just anyone to connect to our instance that has Xdebug enabled. Thus we will let Xdebug only use the local host (127.0.0.1) address when running and expecting connections. We will then use the SSH tunnel and “link/forward” port 9000 of the server to port 9000 of our local machine that has the IDE and Xdebug client running.
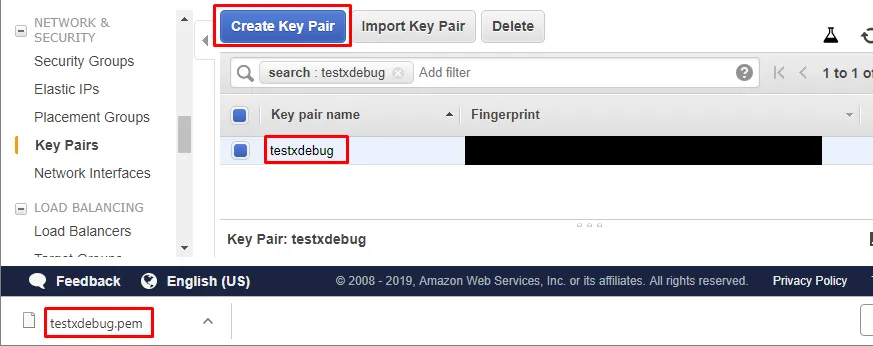
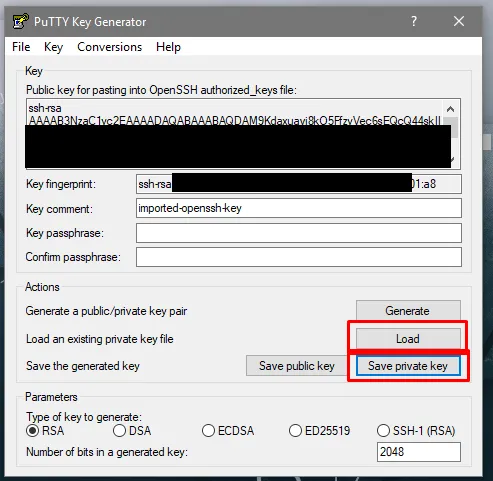
Download the key, open Putty Keygen, then import the .pem and generate a .ppk file. This will be used as our SSH authentication to the server. Images below for convince.
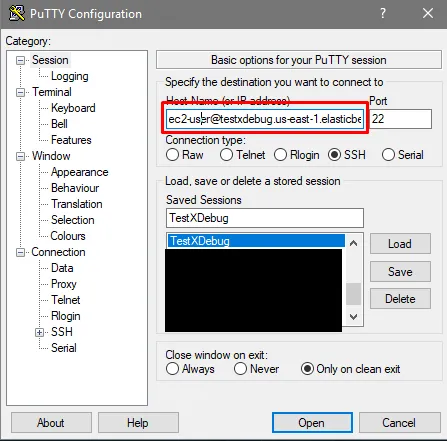
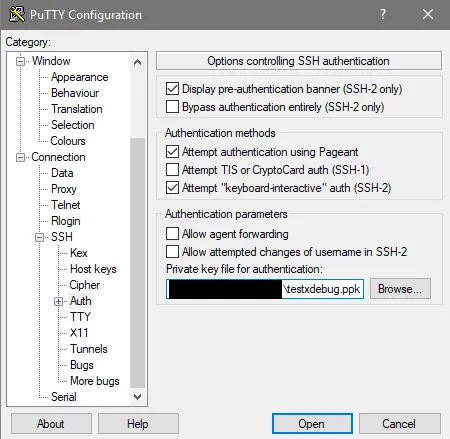
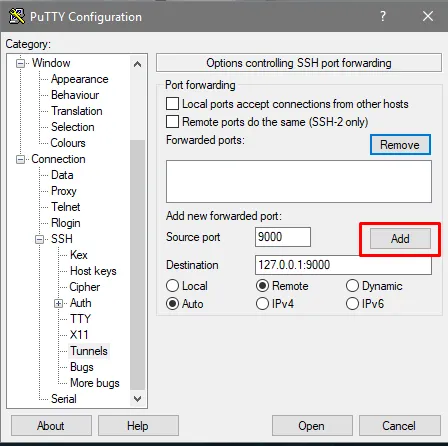
Above we set the values to enable the SHH tunnel, the tunnel will be open whenever this SSH connection is open. So if you close the terminal/session it will close the tunnel as well.
#Creating the EB App and Environment
Go to Elastic Beanstalk console, click on new Application, I named mine testxdebugtut. Then let’s create a new Environment, select the Web server environment then we need to configure a few key things.
- Give your server a domain name, if your following along, make it something unique that does not exist yet (not the same as mine)
- Choose PHP as the platform and use the sample application.
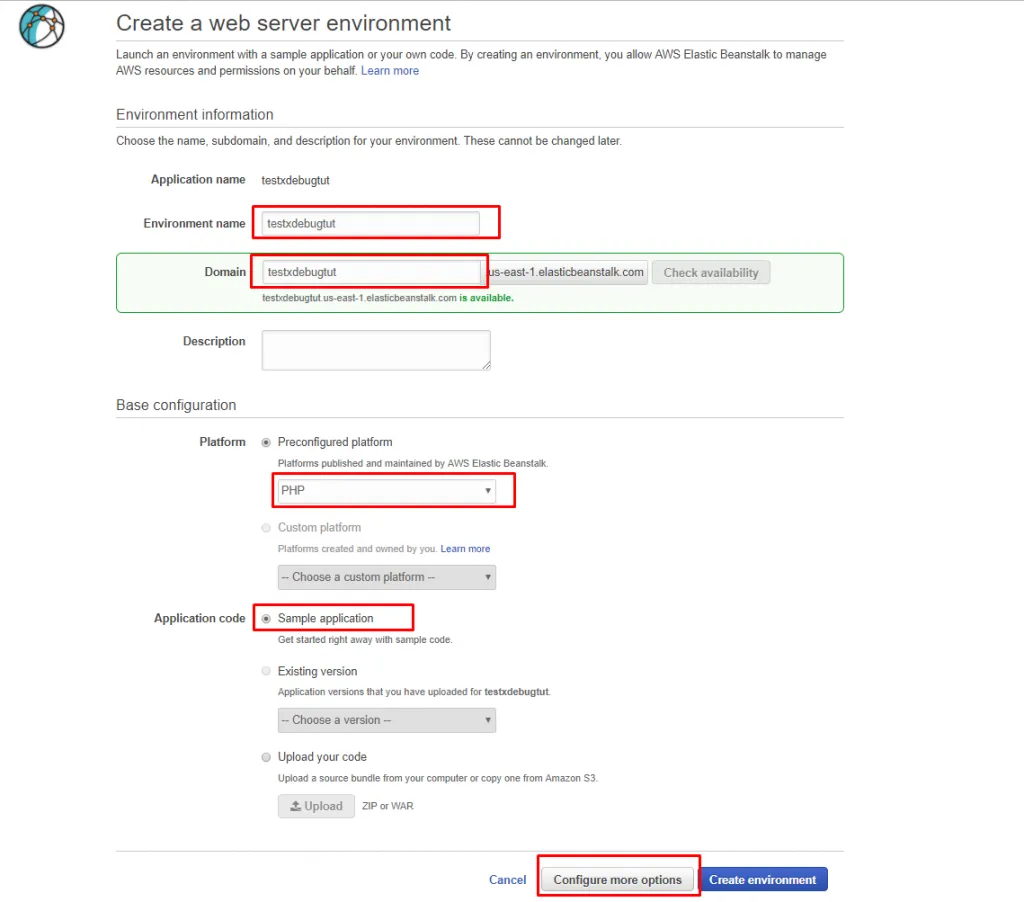
Then click on Configure more options and continue to configure:
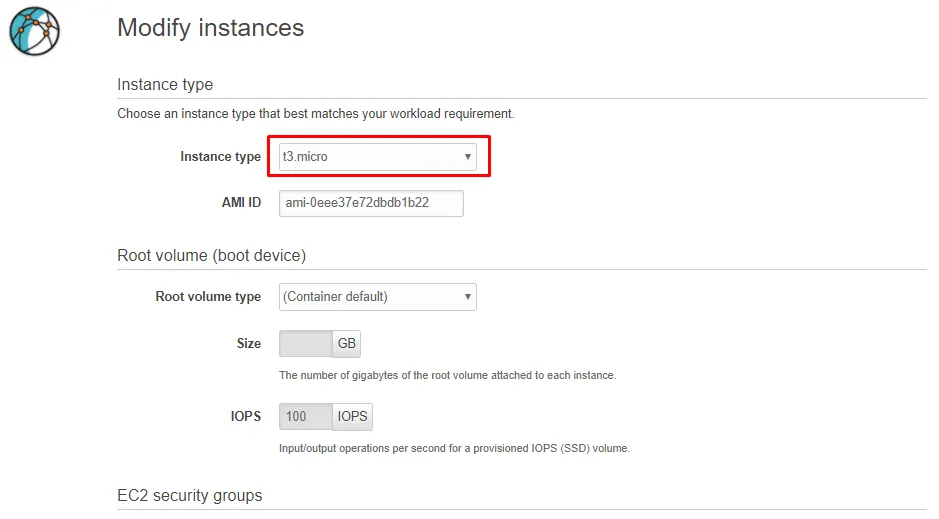
- Instances
- I am selecting a t3.micro for this tutorial as it cost less than the default t2 and has an extra vCPU core.Instances
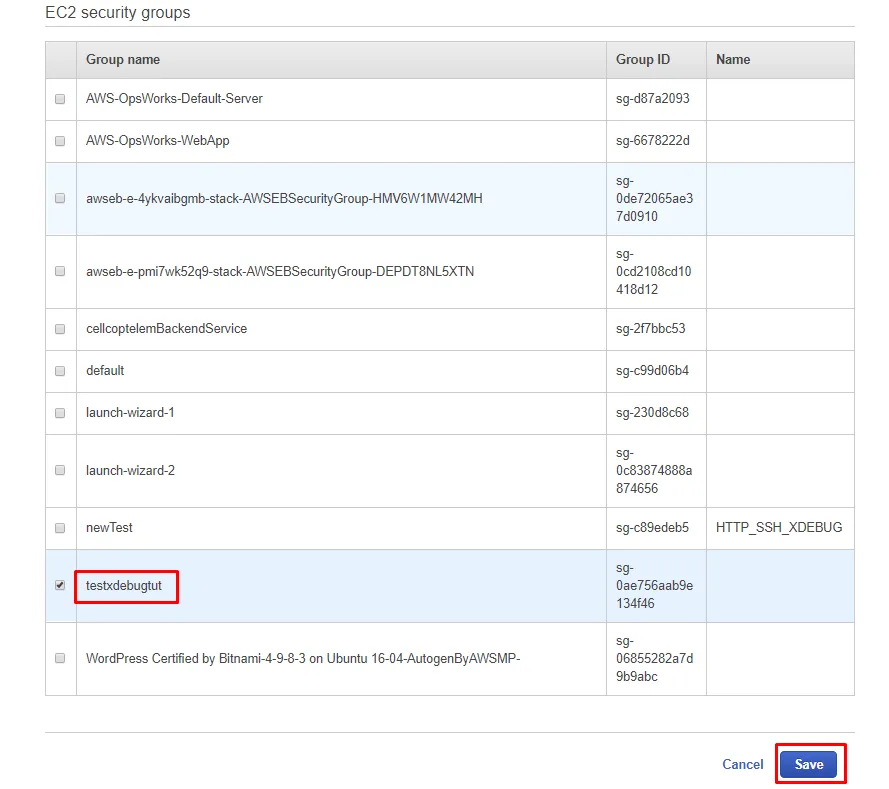
- Then select the Security group created earlier that has the the basic ports open(HTTP, SSH and 9000 for Xdebug)
- Security
- Select the Key pair that we created earlier.
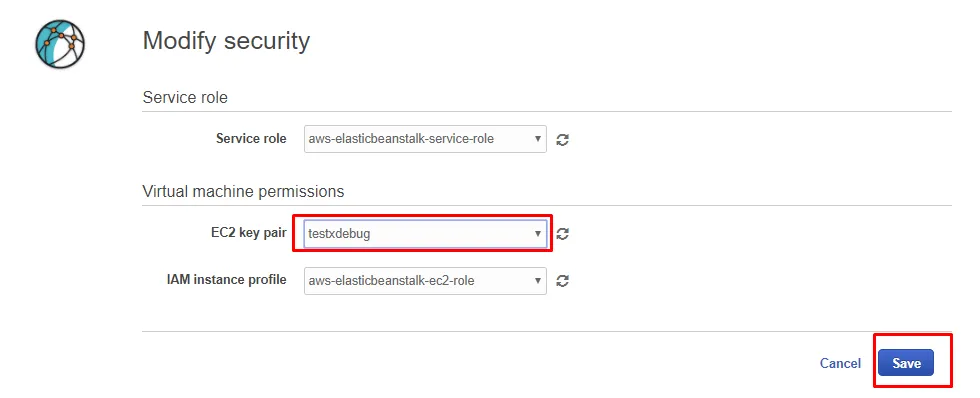
Grab a cup of coffee while AWS EB does all of it’s magic. Then when done verify that everything works, click on the URL to navigate to your website.

#Code and Xdebug config
The completed project code can be found here: https://github.com/rehanvdm/TestXdebug
Now we are going to download the sample project that is currently being used. Navigate to the Application Version page, click on the current version, it will take you to an AWS page of which at the bottom clicking on PHP will download the sample code zipped.

Unzip the code and create an PHP Storm Project from it.
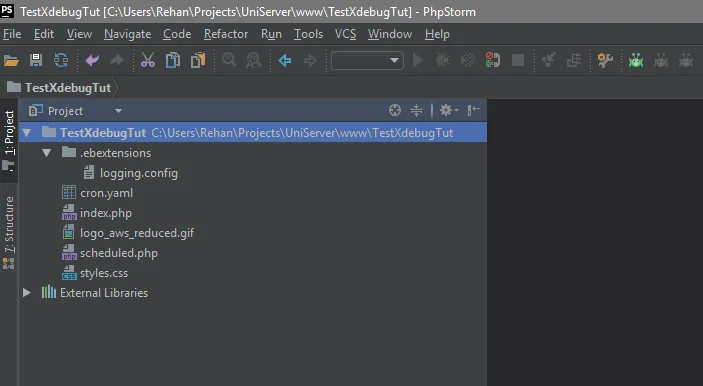
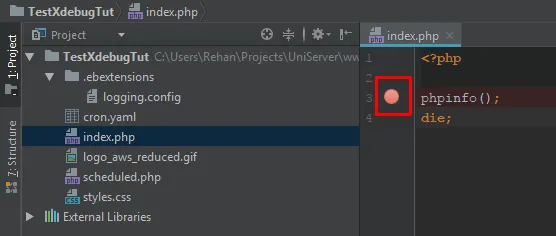
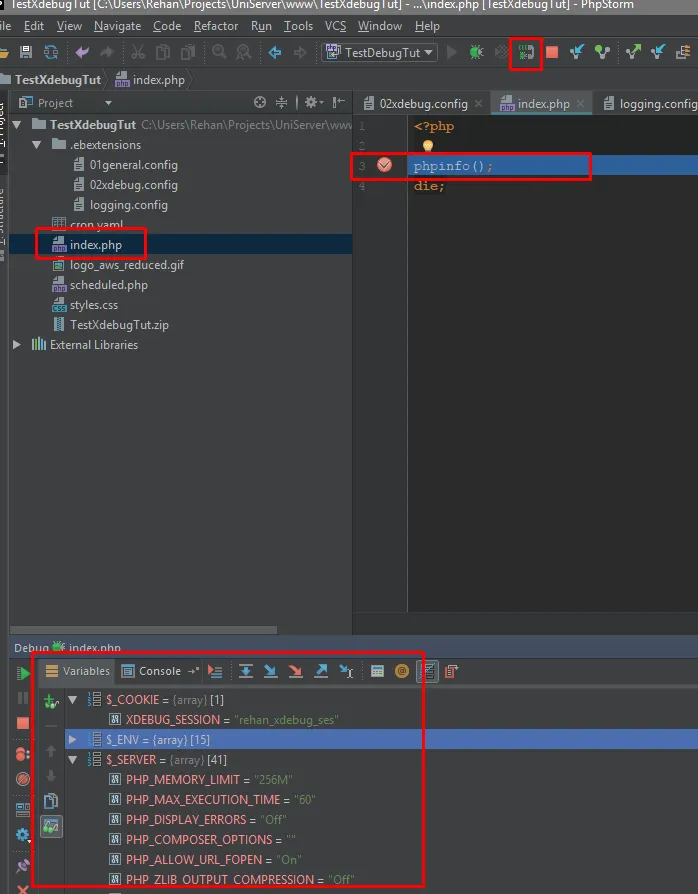
Now we are going to change the default landing page to just do a phpinfo dump and exit. We are also going to place a breakpoint on the line phpinfo() line.
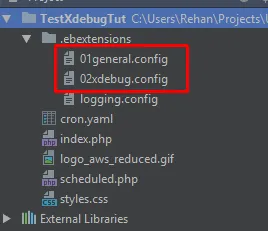
Next we will add two ebextension files, the first is just a general config file that will put our user (ec2-user) in the webapp group. It will also make the project directory on the server writable (/var/app/current/), this is not needed but PHP Storm has a build in Validate Xdebug setup option that creates a php script and runs it on the server to gather info and report back. So this is just to allow that option to work correctly.
file: 01general.config
 # Add the ec2-user to the webapp user group that owns /var/app/current/
 # This is so that if we debug, we can change files in that dir if really needed
 # Be sure to completely close and open PHPStorm if you had the ssh terminal open to this box before this executed
 commands:
     01\_add\_ec2\_user\_to\_group:
         command: usermod -a -G webapp ec2-user
     02\_read\_write\_to\_group:
         command: chmod 775 /var/app/current/ -R
If you had an SSH Terminal session open in PHPStorm before the command was run to add the user to the group, then your session is unaware that your user is now in the new group. Closing the session and opening is not enough, completely close the PHP Storm IDE and then open it again. Then you can open your SSH session again and verify your in the group by running groups
The second file is the Xdebug config. Firstly in the commands block, we run the commands to install and make Xdebug from source. It is important to know what version of PHP you are running, you can verify by looking at the PHP version reported on the EB console dashboard. At time of writing this was version 7.2 ,be sure to replace your version number with the correct one. These commands are taken from the xdebug website (https://xdebug.org/download.php) also note that at time of writing 2.7.0 was the latest.
In the files block we add an ini file that will be read by apache when it starts up, it specifies the location of the Xdebug and then sets certain options of which the following is noteworthy:
- **remote_enable=1 ** This enables xdebug, set to 0 if you want to turn it off
- remote_port=9000 The port on which we will connect to xdebug
- remote_host=”127.0.0.1” This is the address it will look for connections
- remote_connect_back=0 This one tells xdebug that it must not allow any one to connect ,only the allowed host(127.0.0.1)
- idekey=”rehan_xdebug_ses” This is so that we can have many connections open and that they don’t clash, it is also the name of the cookie that we will set on website and then in the IDE when defining the connection.
Then in the container commands block we just restart apache, note that we need to say /sbin/service instead of just service.
file: 02xdebug.config
# Have to install from source ,pecl7 tries to be smart, installs and makes configuration changes, then breaks it on AWS EB PHP 7.2
#  so much that php -i then reports that it is php 7.0.3
 commands:
     01\_xdebug\_install:
         cwd: /tmp
         command: |
             wget https://xdebug.org/files/xdebug-2.7.0.tgz -O xdebug-2.7.0.tgz \
             && tar -xvzf xdebug-2.7.0.tgz \
             && cd xdebug-2.7.0 \
             && phpize \
             && ./configure \
             && make \
             && cp modules/xdebug.so /usr/lib64/php/7.2/modules

 files:
   "/etc/php-7.2.d/xdebug.ini":
     mode: "000644"
     owner: root
     group: root
     content: |
       zend\_extension = /usr/lib64/php/7.2/modules/xdebug.so
       xdebug.remote\_enable=1
       xdebug.remote\_port=9000
       xdebug.remote\_host="127.0.0.1"
       xdebug.remote\_connect\_back=0
       xdebug.remote\_mode=req
       xdebug.idekey="rehan\_xdebug\_ses"

 container\_commands:
     01\_reload\_server:
         command: /sbin/service httpd restart
This is where I spent most of the time on this whole process. I firstly tried to use pecl7 to install xdebug without any luck. Pecl7 somehow installed and configures Xdebug in such a way that it completely breaks the appache server. The server will start but after investigation it looks like it changed some files and permissions as fast cgi complains that it cannot find the files and then just returns a generic 500 error. SO DO NOT USE PECL7 TO INSTALL XDEBUG
Also take note of the naming of the files, Elastic beanstalks run all the files under the .ebextension directory in alphabetical order, so we can control the order by adding a number in front of the file. There is also a distinct difference between commands and _container_commands _ , you can find out more here and here.
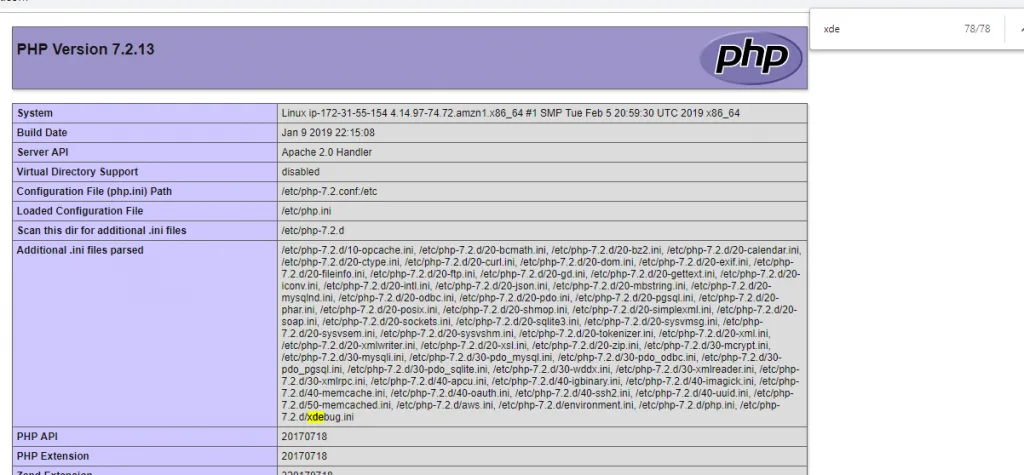
Now we can zip the code, go to EB dashboard, click on deploy, select the zip and deploy. Wait a few minutes until deployed, then we can verify that it works by going to the URL again. This time you will be greeted with a PHP Info page, where you can search for xdebug and verify the parameters set by the .ebextension config file are read.
#PHP Storm Config
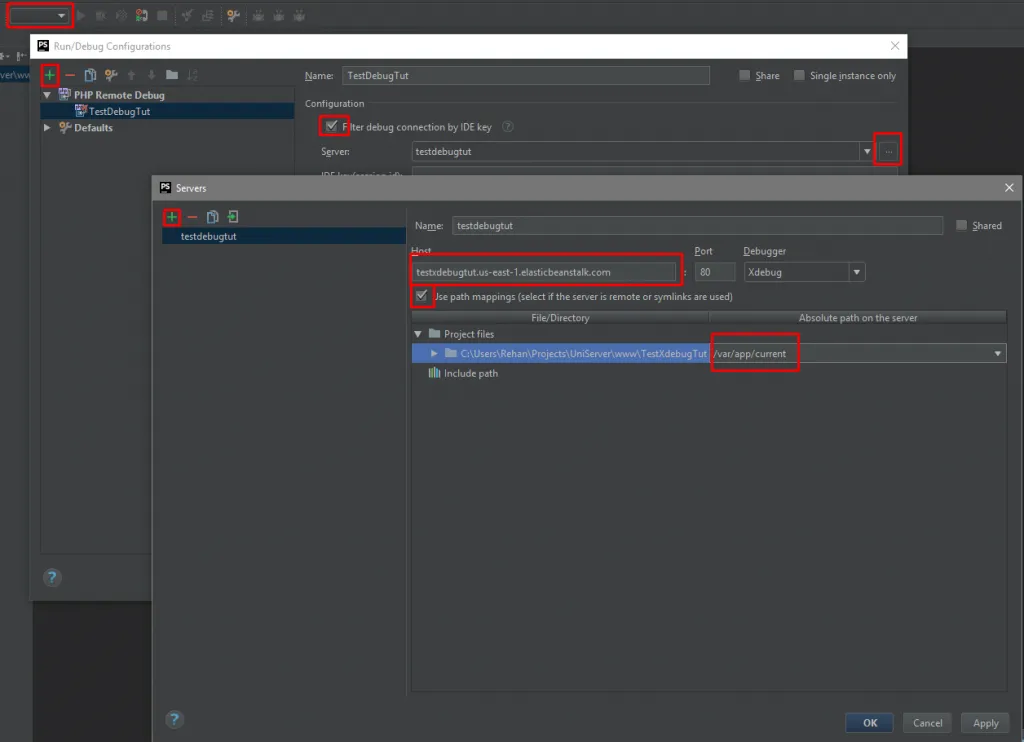
Now let’s configure PHP Storm, first click on edit configurations, then add a new PHP Remote Debug config. Then click on the 3 dots next to server to create a new server, type only the hostname and make sure that the path mappings is correct (this is crucial). Then back at the configuration, make sure to fill in the IDE key to be the same as in the .ebextension file (02xdebug.conf).
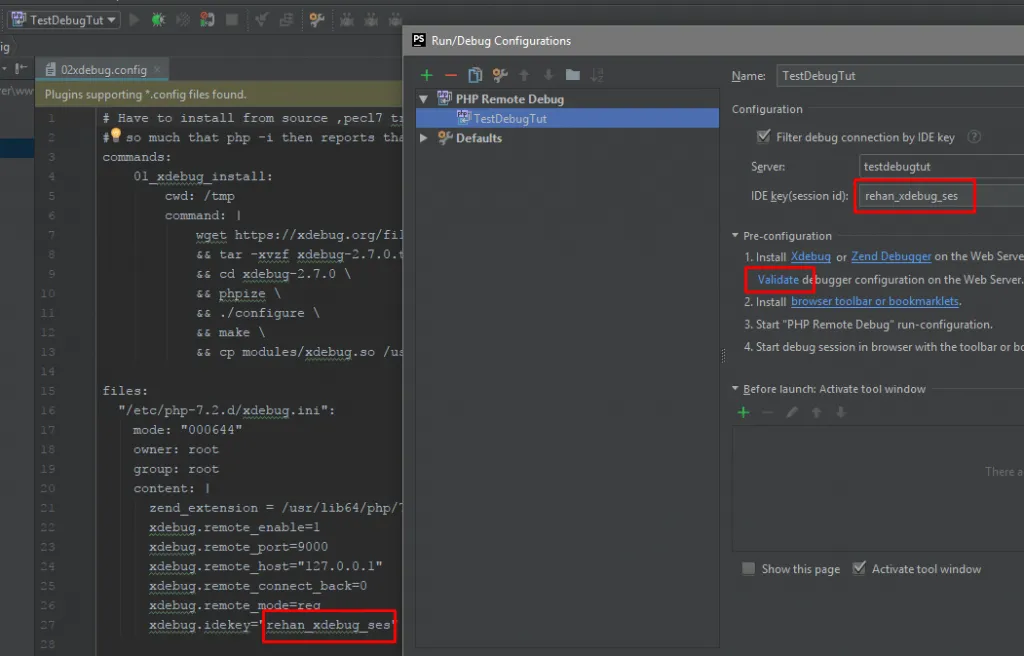
Now click on the validate option, then choose Remote Web Server. Add your remote as shown in the following pictures. Very important is the Root Path must be at root (/) and in the mappings part, again set the deployment path on the server to /var/app/current.
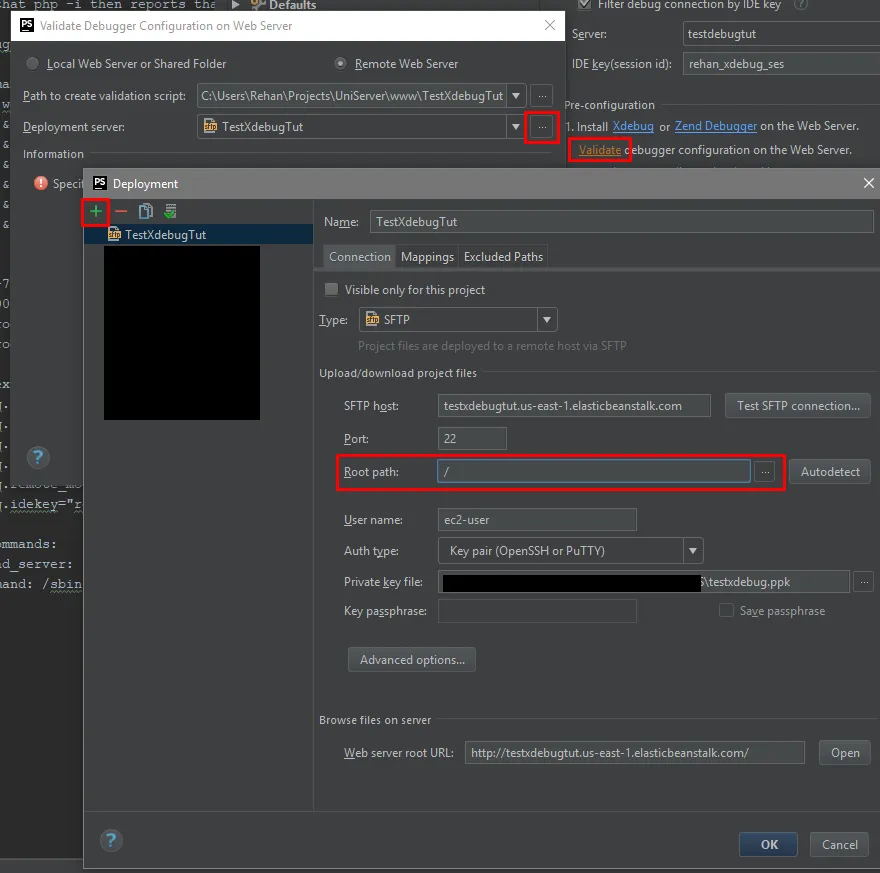
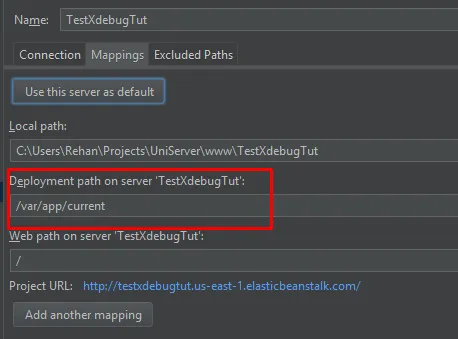
Then click on validate and PHP Storm should come back with a friendly checklist.
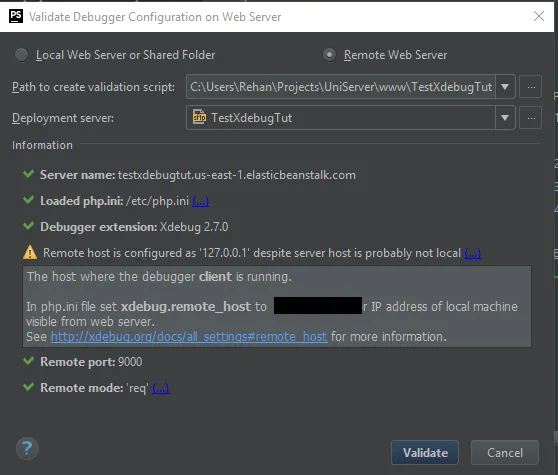
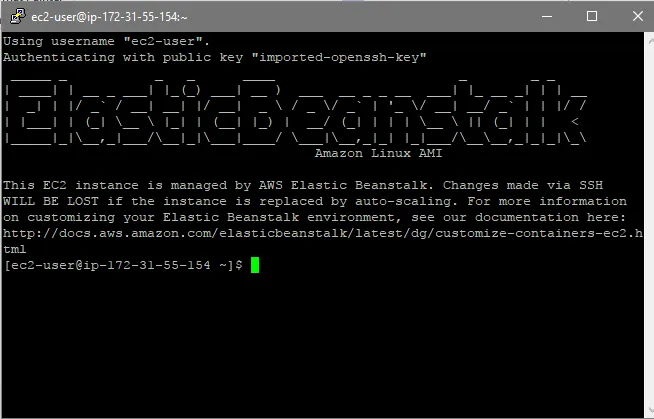
Exit the screen and click on OK to close the configuration page. Now we need to open the SHH tunnel, so open your Putty and connect to the profile we created earlier. Make sure this stays open.
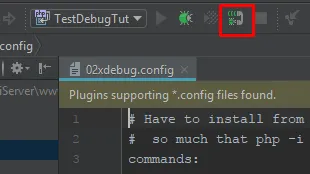
Now we can go back to PHP Storm, and start listening to debug connections by clicking on the green telephone.
#Browser Config
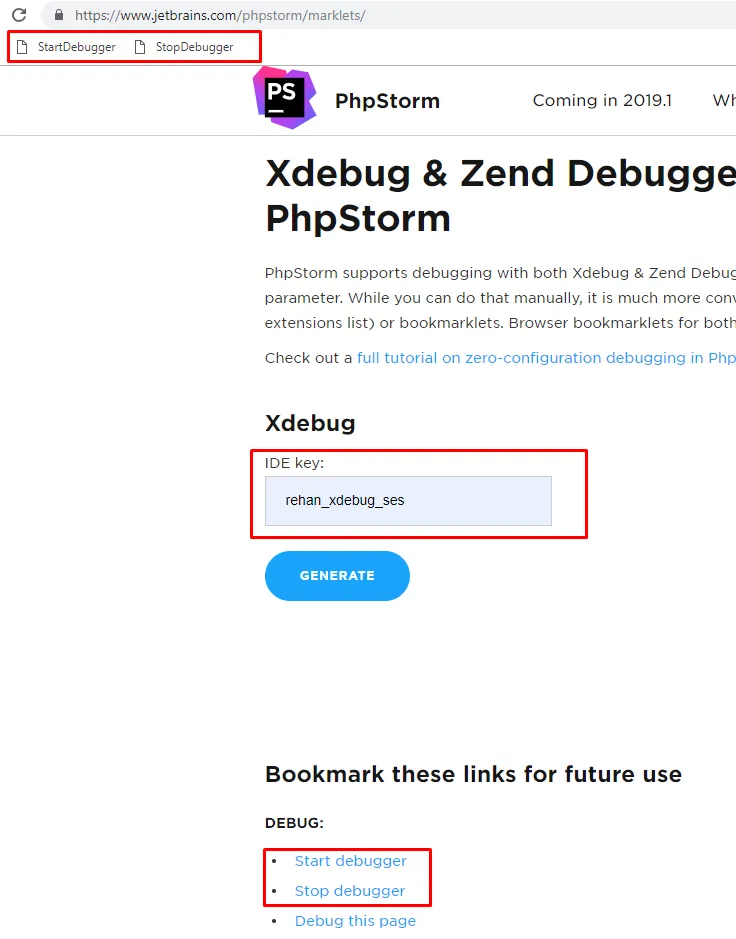
First let’s use the page from Jetbrains to generate a bit of JS code that just adds a cookie to the page you are on. Navigate to https://www.jetbrains.com/phpstorm/marklets/ then make sure that the IDE key fields is the same as in our xdebug.ini file. Click Generate, then Bookmark the Start and Stop debugger links. This creates a cookie (XDEBUG_SESSION) on the page you are currently at when clicking on the link.
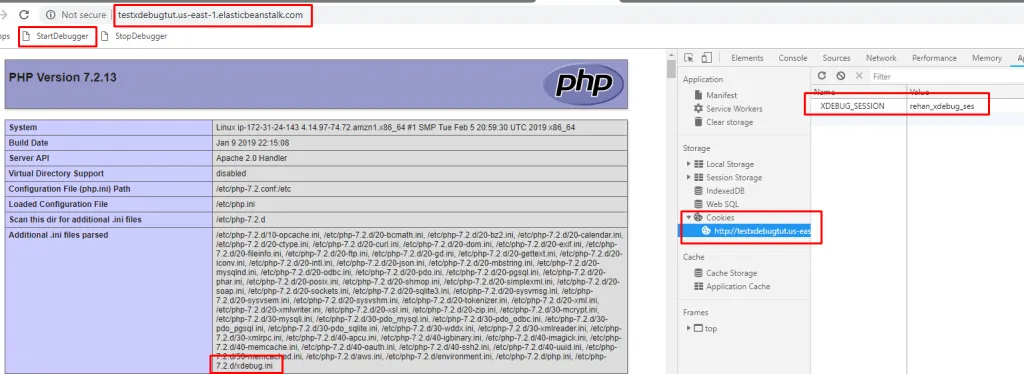
Now we can go to our website, click on the Start debug Bookmark and the cookie should be set. We can verify this by opening dev tools and inspecting the cookies for our website.
#Testing
Make sure that your PuTTY SSH connection is open and connected, we need it to stay open else the SSH tunnel will also close. Go to the project in PHP Storm, and make sure that the Telephone icon is green, meaning that we are listening to PHP Debug connections. Then just refresh your website, it will hit the breakpoint that is set on the index.php page. Yay!
#Troubleshooting
- Make sure that the CORRECT cookie name is set throughout the whole process (PHP Storm, Browser and Xdebug.ini file on server)
- Use https://xdebug.org/wizard.php to verify if your Xdebug is installed correctly.
- Remember the SSH Tunnel needs to stay open for the duration of the debug session.
- Enable the Xdebug logs to help find mistakes, add this line: xdebug.remote_log=/tmp/xdebug.log to your xdebug.ini file, then inspect the log to see any problems.
- To test if the EB instance can talk to the Dev machine, open an SSH connection to the EB Instance, then telnet 127.0.0.1 9000, telnet should report back with connection open.